Market Review & Strategy
March quarter lows provided the way station for a June quarter advance in global equities.
Predictably, US stocks underwrote the renewed interest with pleasing first quarter earnings, excitement about the rise of AI and its multipliers, and a general indifference towards events in the Persian Gulf providing the impetus.
Interest in equities would also broaden into quarter close with long overlooked small caps, value names and healthcare stocks getting a bid.
The month of June saw investors aggressively rotate away from AI infrastructure names (those making the AI investments) into semiconductor stocks (those benefitting from the AI spend). Focus was trained on ever-increasing sector capex (broad consensus of USD725bn for CY26e/USD729bn CY27e) abetted with increasing financial leverage and concerns around the prospects of appropriate returns at scale for much of the investment.
Local large and small caps trod a volatile path to finish modestly ahead for the three months to close of June. The release of a contentious federal budget on May 12 rankled investors, prompting a humorous AFR pull-quote ‘Rather than lift all boats, this budget sinks all yachts’[1]. Traders vented on CBA with its 10% sell-off post budget labelled as its worst one day move in 30 years.
In keeping with seasonality, earnings confessions from ASX-listed names were a feature of the quarter. Several positive updates (SGM, SXE and SRG) were drowned out by a slew of negative revisions including, among others, WOR, NAB, CWY, A2M, BBN and COH. One of the most disappointing updates was from JDO, whose share price fell 40% on the reporting of several problematic loan exposures despite a Macquarie Conference guidance confirmation in early May.
On the merger and acquisition front, several bids were unveiled during the quarter. IFM Investors officially bid for Atlas Arteria in late April, Frasers Group PLC moved on Accent Group (as well as Hugo Boss AG), private equity concern EQT approached Perpetual (only to be rebuffed, rebid, and rejected for a second time) in the early weeks of July. Regis Resources bid for Vault Minerals complete with follow-on bid from Genesis Minerals and a US-based consortium of Amwins Group and Dragoneer Investments bid for Steadfast Group.
Equity capital markets activity continued at pace with scores of small raisings bound up with large. Next DC raised $1.5bn in equity and later issued $1.7bn in subordinated debt securities as a part of a wider capital drive. Interesting to note Telix Pharmaceuticals opted for a $900m convertible bond raising over conventional equity during the period. Megaport raised $827m, Elevra Lithium $275m (part of a larger financing), BWP Property Group raised $228m and Navigator Global $145m.
By The Encyclical’s reckoning, around 10 small companies IPO’ed during the quarter including the L1 Gold Fund ($750m raise) and Skin Candy ($160m). Just over 50% of the cabal were better than issue price at June end.
Undoubtedly the most extraordinary event of the quarter was the successful IPO and listing on Nasdaq of Space Exploration Tech Corp (SpaceX), raising USD75bn with over USD220bn of stock demand. A bespoke Australian prospectus received royal ascent from ASIC with Commsec confirming > 28k retail applications for stock following 37k new account openings. Elon Musk retained a 42% stake plus several venturesome KPI’s, including one predicated on the establishment of a 1 million person Mars colony. The stock debuted at a 19% premium to offer price, a crowd pleaser and second only to the Belgium world cup soccer win.
S&P Dow Jones tabled their latest changes to sovereign equity market classifications during the quarter. Greece moved up to developing (from emerging), Iceland to emerging (from frontier) with Indonesia facing potential relegation to frontier status. The proposed 2012 GREXIT and the 2008 Icelandic bankruptcy now distant memories.
It is important to note the passing of two US market titans. Ted Turner (aged 87), the redoubtable investor in US media assets, particularly CNN and Alan Greenspan (aged 100), President of the US Federal Reserve (1987-2006). The Maestro was famous for coining ‘irrational exuberance’ whilst describing the 1996 stock market bubble.
Technical Summary
Stocks
Equities in the US appeared to enter the June quarter ‘spring loaded’ courtesy of the preceding quarters retracement. Price action across the S&P 100, 500 and Nasdaq Composite was eerily similar-multiple running gaps (✔), enlarged traded volumes (✔) and old high reclamation (✔). June marked a period of congestion ahead of a firm start to July. NB: the S&P500 Equal Weight benchmark has had no such pause reflecting the increased stock participation in the advance. The correction to the Bloomberg Mag 7 Price Index presents as a healthy reset in price level with the primary uptrend in tact.
The persistent strength of the S&P 1000, Russell 2000 and the Russell Microcap benchmarks is notable, with these rallies neatly in price/time balance.
The outperformance of value stocks versus growth names in recent months needs to be monitored given investors long term disposition (at least since 2013) towards growth names.
Whilst weaker seasonal effects might impact on stocks through to October, not fighting the tape continues to be the dictum for investors in US stocks.
The STOXX 600 Index, representative of Europe’s major listed companies, recently broke to all-time highs, clearing the upper bound of a bullish trend channel in place since March 2009. Clearing trend channels to the upside is customarily an indicator of over-extended price action and a signal for some form of market correction.
Locally, the All Ordinaries Index congested into a symmetrical triangle through the period, trading above and below the 100-day moving average or investment line. The historic high of 9436, struck on February 27 feels safe from re-test in the short term.
The S&P/ASX Small Ordinaries yielded directionless trade during the June quarter however it is encouraging to note improved market breadth when compared with the prior quarter. Some 43% of stocks were trading above the 100-day moving average, approximating the mid-point reading of the range of typical breadth outcomes for the index.
The Williams %R oscillator highlights the oversold nature of the small cap market but price action feels fragile looking across the universe, so a downside test should not be ruled out. For the first time since December 2024 investors saw small industrial names outperform small resources stocks.
Commodities/Currencies
Brent prices concertinaed from their late April highs of USD126.40/bbl as foreshadowed in our last quarterly missive. USD70/bbl appears to be a safe harbor for the commodity but we would like to see more time pass before turning constructive. Futures positioning is modestly net long and a far cry from being overextended, which is supportive of the pricing environment. At the time of writing crude was trying to rally but we will approach any rally in prices carefully.
Gold price action was insipid during the quarter past and it is interesting to note that gold peaked on the announcement of Kevin Warsh’s appointment to Federal reserve chair at January close. The metal has found solace on a year-old support line remains beholden to the investment line which has now rolled over, reflecting the shift lower in momentum. USD3900 has shown to be convenient support for longs but doubtless it will be probed in coming weeks/months. It is surprising that futures positioning (on the long side) has picked up since last quarter with 6.4:1 long:short and not conducive to a rally from current levels
Silver has suffered under a surfeit of speculative holdings and these hands have become weak as the price extends its retreat. The metal is benefiting from a support line originating in April 2025 but validation will come with how it performs under future moves lower. Like gold, silver feels fragile at present and traders need to continue to monitor it.
The London Metals Exchange LMEX Index hit historic highs in early June only to cool down into quarter close. Copper, 31% of the benchmark, forged to new highs whilst aluminium, a 43% constituent, failed to take out March 2022 levels. The outlook for the complex continues to configure constructively.
The set-up for the AUDUSD remains enticing despite its recent recoil from $0.7278 back to $0.6834. Interesting to note trader positioning shifted from net long to its more common net short posture as players took profits on the rally since June 2025 and set their books for further weakness. The US Dollar Index has firmed appreciably since early May, largely on the back of a continuing weak yen and should be monitored for further upside.
It is heartening to see the nine month old cryptocurrency savaging may be abating with the Bloomberg Galaxy Crypto Index finding buyers on a medium-term support line originating from the covid lows of 2020. Failure of Bitcoin and Ethereum (each capped at 35% weights) to hold here would be an adverse development for the index’s precarious position.
The Log – A Bayesian Horserace
In the 2015 book “Superforecasting: The Art and Science of Prediction”[2], Tetlock and Gardner showed that the most famous forecasters tend to be the least accurate. Fame rewards “hedgehogs”[3], which are forecasters who lock onto one vivid narrative and neglect base rates. Although Bayes’ theorem[4] (1763) formalises how a base rate (or prior) should be combined with new evidence, Kahneman also provides a simple approach for avoiding “base-rate neglect” outlined in Chapter 18 of Thinking Fast and Slow (2011)[5]:
- Start with a relevant base rate like an average or probability using historical data.
- Form an intuitive forecast based on additional available evidence.
- Estimate the correlation between that evidence and the outcome being forecast.
- Shrink the forecast toward the base rate according to that correlation. E.g. If correlation is 0.30, move 30% of the distance from the base rate to the forecast.
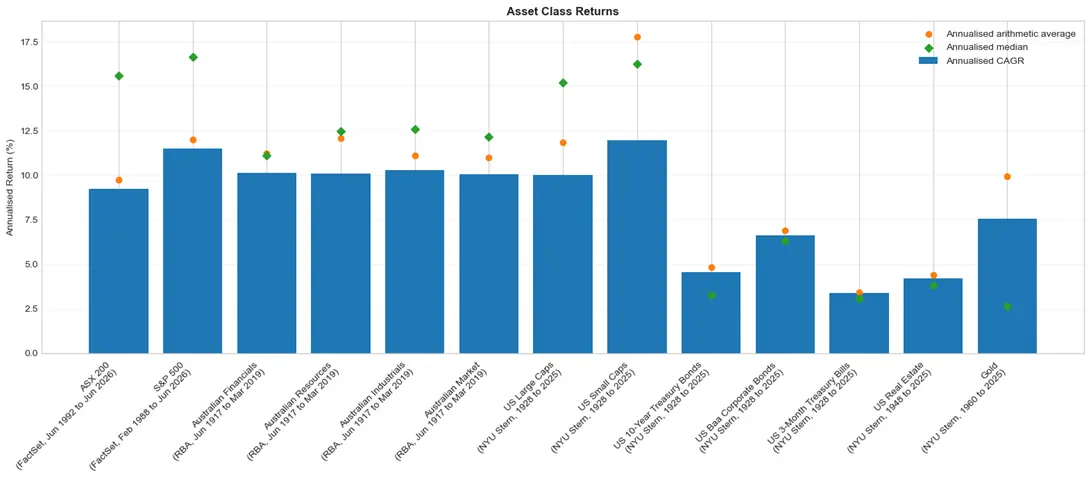
Suppose you wanted to make a forecast for the stock market’s return in the next one, five or ten years, but you wanted to avoid jumping straight to “arm waving” narratives about things like AI. What would be the right base rate to use before incorporating additional information and how much would a Bayesian and Kahneman approach improve on base rates? Let’s try to answer these questions empirically by running our “Bayesian Horserace” using returns data for these 13 asset return series.
Source: FactSet, RBA, NYU Stern, Shillerdata.com
Using an expanding window, we test whether the running average, median or compound annual growth rate (CAGR)[6] has the lowest error for forecasting the next period’s return. We also combine these base rates with a forecast based on the prevailing dividend yield (DY) and earnings yield (EY) relative to their averages to form Bayesian and Kahneman indicators for the 7 equity market return series for which we have fundamental data.
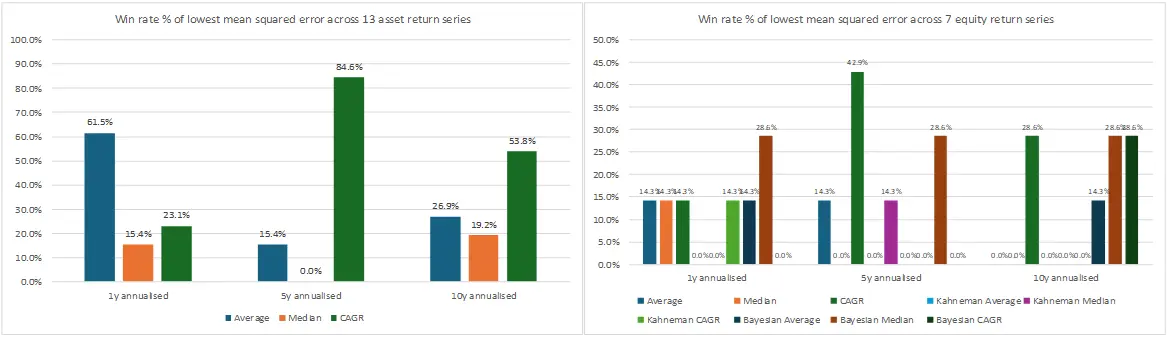
Source: FactSet, RBA, NYU Stern, Shillerdata.com | Median absolute error favoured CAGR at 1y. Bias favoured average for 1y but similar for 5y and 10y.
In the first chart on the left, a clear pattern emerges. The average of past returns is the clear winner for a 1y forecast horizon with a 61.5% win rate but CAGR wins for the longer 5y (84.6%) and 10y (53.8%) horizons. This result is consistent with the literature[7]. However, the size of the errors for a 1y forecast horizon are very large. E.g. a 1y forecast implied by the average is 10% +/-15% for the ASX 200, so any approach is really a wild guess, including for our Bayesian and Kahneman indicators.
In the second chart on the right, there are two additional findings. First, the CAGR clearly performed best at the 5y forecast horizon and remains competitive at the 10y horizon. Given the size of the errors are much smaller at longer time horizons, CAGR is likely to be a reasonable base rate for a longer-term forecast. E.g. a 5y forecast implied by the CAGR is 9% +/-6% for the ASX 200. An intuitive interpretation is the CAGR reflects the underlying growth rate of the return series, which becomes more apparent as short-term return noise averages out over longer horizons[8].
Second, the Bayesian indicator had higher win rates than the Kahneman indicator across all three horizons and across equity return series, likely because of the way it uses the valuation information in proportion to the certainty of the valuation signal[9].
If a Martian came to Earth seeking to make a long term return forecast, our study suggests they should start with the historical CAGRs. They might then consider incorporating valuation information using a Bayesian approach. At shorter horizons like 1y, they should start with the arithmetic average but be aware of large forecasting errors, likely due to variables like investor flows[10]. At any rate, the base rates tested above should be something for “hedgehog” forecasters to think about.
Outlook
There can be little doubt the USD75bn IPO of Space X has put US equity capital markets on blue flame. That this deal can cause an investor stampede in Australia points to a long absent awakening in animal spirits for the local household investor.
Whilst overwhelmingly positive in the first instance, it should be viewed cautiously in the context of the evolution of the market cycle and what such euphoria ultimately portends. Further, Anthropic (USD1tn valuation), OpenAI (~ USD852mn) and Kalshi (USD40bn) are reportedly close to announcing initial public offerings and perhaps the same herd of fevered local investors will look to participate here.
Domestically, we have AI infrastructure group Firmus Technologies tapping capital markets with ease (~USD330mn Series 1 raising in September 2025, ~ USD520mn series 2 in December 2025 and USD505mn series 3 in April 2026). The AFR on July 9 reported that the group is now poised to launch a series 4 round raising of ~ $2.9bn ahead of an ASX listing at some point in 2026[11]. This will be a good test of local market vitality.
Goldman Sachs (GS) analyst, Ben Snyder, in a recent GS Exchanges podcast summarises the IPO state of play in the US. To date ~ 50 companies have come to market, following 4 years of muted activity which compares with 250 in 2021 and 400 in 1999. GS estimate equity supply at ~USD700bn which is around 1% of the current market and less than corporate buybacks expected at ~ USD1tn in 2026[12]. In short, things are less frenzied than the headlines might suggest and new stock issuance will be easily absorbed by the market.
If prior capex cycles are any guide, then the prevailing AI capex boom may contain the seeds of its own demise-in time. Recall the US Shale gas boom of 2008-2014, the Internet boom of 2000, the electrification of the 1920’s and the British Canal mania of the 1790’s where capital supply → excess capacity → poor returns and a contraction in equity valuations. Edward Chancellor in his excellent book Capital Returns: Investing Through The Capital Cycle urges investors to watch rising capex closely as it is frequently a warning signal for future profitability, tending to proliferate at peaks and dissipate at troughs[13].
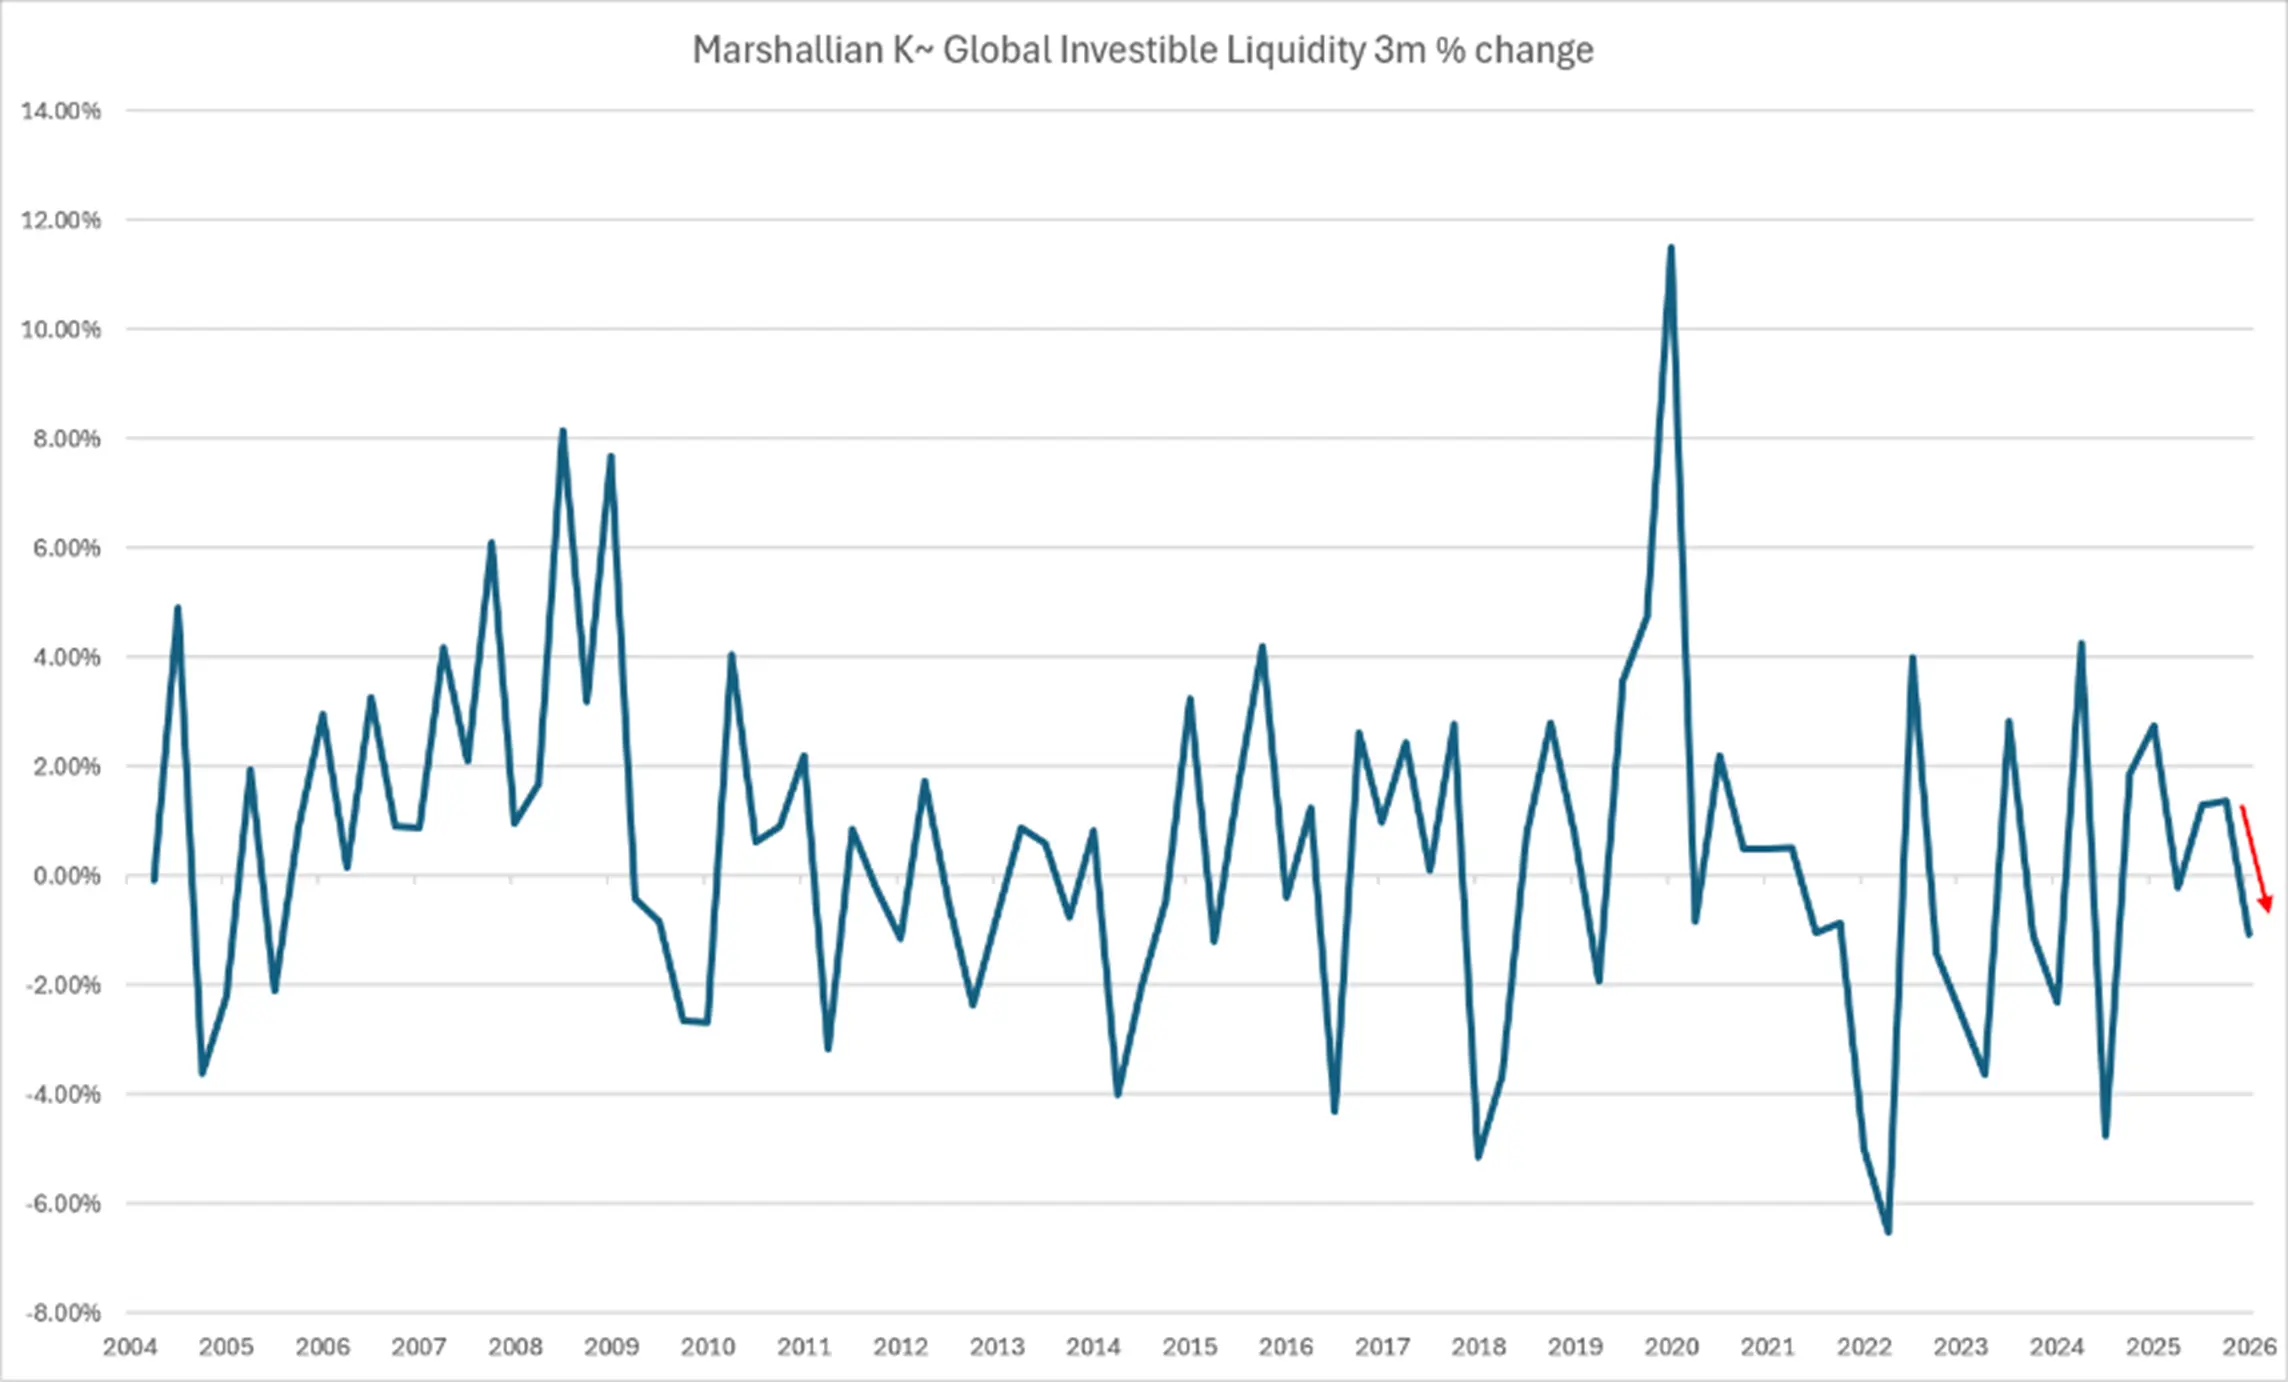
Students of Marshallian K (Δ MS%-Δ IP%) will have noticed that excess liquidity has recently turned negative. This represents available investible global liquidity once people have consumed goods/services from the real economy and its ebbing is unhelpful.
Source: Eley Griffiths Group Data & Quant Unit, FactSet
In the meantime, the primary trend for global equities continues upwards. US credit spreads remain benign, inflation break-evens are in retreat and with the real fed funds rate at 0.35%, it’s probable the Federal Reserve will remain on hold with rates for the foreseeable future. Valuations are fulsome but earnings momentum continues to underwrite that confidence. The case for equities remains intact with a few structural developments, noted above, to keep a weather-eye on.
Disclaimer
This document contains general market commentary prepared by Eley Griffiths Group Pty Limited (ABN 66 102 271 812, AFSL 224 818) (EGG). It is not independent research. References to specific securities, issuers, indices, sectors or strategies are for general information only and do not constitute a recommendation to buy, sell or hold any financial product. Information contained in this report is derived from the authors observations and interpretations of market events, public announcements and various stock exchange news releases. These will be typically sourced from data vendors, news wires and the wider financial press unless specifically attributed in the text or footnotes.
EGG, its related bodies corporate and/or their respective directors and employees may from time to time hold interests in, or transact in, securities or other financial products referred to in this document.
The information is intended for wholesale clients within the meaning of section 761G or 761GA of the Corporations Act 2001 (Cth) (Corporations Act) and must not be made available to any persons that are “retail clients” for the purpose of the Corporations Act.
The information is current as at the date of preparation and is subject to change. The information does not consider the investment objectives, financial situation, or particular needs of any individual. Before making an investment decision, you should consider obtaining professional investment advice that considers your personal circumstances and read the relevant disclosure document to determine whether an investment is right for you.
EGG has obtained information from sources it considers to be reliable, but does not represent that such information is accurate or complete, or that it should be relied upon. EGG makes no representations or warranties, express or implied, as to the accuracy or completeness of the information it provides and to the maximum extent permitted by law, neither EGG nor its directors, employees or agents accept any liability for any loss arising in relation to this information.
This document may not be reproduced or copies circulated without prior authority from EGG.
Any opinions, forecasts, estimates or projections reflect judgments of EGG as at the date of this document and are subject to change without notice. EGG does not guarantee repayment of capital or any particular rate of return. An investment may achieve a lower-than-expected return and investors risk losing some or all of their principal investment. Any forecasts, estimates or projections as to future returns should not be relied on, as they are based on assumptions which may or may not ultimately be correct. Actual returns could differ significantly from any forecasts, estimates or projections provided. Past performance is no indication of future performance.
[1] Australian Financial Review, ‘Rather than lift all boats, this budget sinks all yachts’, Philip Coorey, 12 May 2026
[2] Tetlock, Philip E., and Dan Gardner. 2015. Superforecasting: The Art and Science of Prediction. New York: Crown Publishers.
[3] From the Greek poet Archilochus: “The fox knows many things, but the hedgehog knows one big thing.”
[4] Bayes, Thomas. “An Essay towards Solving a Problem in the Doctrine of Chances.” Philosophical Transactions of the Royal Society of London 53 (1763): 370–418.
[5] Kahneman, Daniel. 2011. Thinking, Fast and Slow. New York: Farrar, Straus and Giroux.
[6] CAGR is lower than average as volatility lowers realised returns. See Mindlin (2011) Mindlin, Dimitry, On the Relationship between Arithmetic and Geometric Returns (August 14, 2011) and Becker (2012) Becker, Robert A., The Variance Drain and Jensen’s Inequality (March 19, 2012). CAEPR Working Paper No. 2012-004.
[7] Jacquier, Kane and Marcus (2002) show that the efficient minimum mean squared error estimator approaches the arithmetic mean when forecast horizons are short relative to the historical sample size. As the forecast horizon increases relative to the sample size, the optimal estimate falls toward the geometric mean, equalling it when the forecast horizon is one-third of the estimation period. Jacquier, Eric and Kane, Alex and Marcus, Alan J., Optimal Forecasts of Long-Term Returns: Geometric, Arithmetic, or Other Means (October 2002). Boston College Working Paper.
[8] In log space, returns becomes additive, so the average log return corresponds to the CAGR.
[9] We used the residual variance of a regression of returns on the deviation of the prevailing DY & EY to their running averages as an input to the measure of certainty for the Bayesian indicator, and the correlation from the same regression for the degree of adjustment applied by the Kahneman indicator.
[10] See Gabaix and Koijen’s Inelastic Markets Hypothesis, which argues that flows can have substantial effects on prices when aggregate market demand is relatively inelastic. Gabaix, Xavier and Koijen, Ralph S. J., In Search of the Origins of Financial Fluctuations: The Inelastic Markets Hypothesis (December 23, 2023). Swiss Finance Institute Research Paper No. 20-91.
[11] Australian Financial Review, StreetTalk, 10 July 2026
[12] GS Exchanges, What The IPO Boom Tells Us, 23 June 2026
[13] Chancellor, Edward, ed. Capital Returns: Investing Through the Capital Cycle: A Money Manager’s Reports 2002–15. Houndmills, Basingstoke, Hampshire: Palgrave Macmillan, 2016